 |
| Riverside Historic Cemetry |
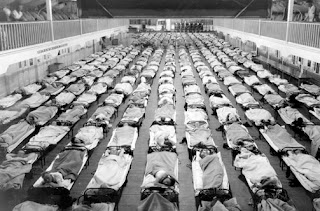
For this lab we went to the Riverside Historic Cemetery. When I first found out that our ENB lab was going to be at a cemetery I was a little confused and (I'm not going to lie) A little freaked out. Once Dr. Rood explained our purpose of being there it made much more sense. We are studying populations and how our population has changed over the years and what can cause our population size to change. We were there to gather information to create a life table. We were told to look for grave stones where the person died in 1918. This year in specific because this was the year of the Spanish Flu epidemic. The Spanish Flu was an unusually severe and deadly pandemic that spread across the world. It can be predicted that there will be a lot more deaths in the year of 1918 compared to other years near to it. Also we wanted to see what age group and sex was most effected by the spanish flu. We can do this by creating a life table.
 |
| People were quarantined during the Spanish Flu epidemic |
 |
| Poster warning of the Epidemic |
A life table aka a mortality table is a table which shows, for each age, what the probability is that a person of that age will die before his or her next birthday. From this starting point, a number of inferences can be derived.
From the information I gathered (which can be seen in my table at the bottom if the page) More men than women died in 1918. This could possibly mean that men were effected more than women by the spanish flu. The females that did die in 1918 were either very old or very young, and this makes sense because the old and the young are the ones most effected my pandemics. MOst of the men who died were in their 40's and older but a few dies in their 20's and 30's. It is very interesting to see and compare all those who died in Macon during the year of 1918.
Heres my life table of those who died in 1818.
| Sex | Year of Birth | Year of Death | Age |
| Female | 1850 | 1918 | 68 |
| Male | 1872 | 1918 | 46 |
| Male | 1842 | 1918 | 76 |
| Male | 1868 | 1918 | 50 |
| Male | 1861 | 1918 | 57 |
| Male | 1852 | 1918 | 66 |
| Male | 1855 | 1918 | 63 |
| Female | 1917 | 1918 | 1 |
| Male | 1880 | 1918 | 38 |
| Male | 1842 | 1918 | 76 |
| Female | 1897 | 1918 | 21 |
| Male | 1886 | 1918 | 32 |
| Female | 1911 | 1918 | 7 |
| Male | 1874 | 1918 | 44 |
| | | | |
| | Video about the Spanish Flu Epidemic Video about some biology students creating life tables | | |
| | | | |


